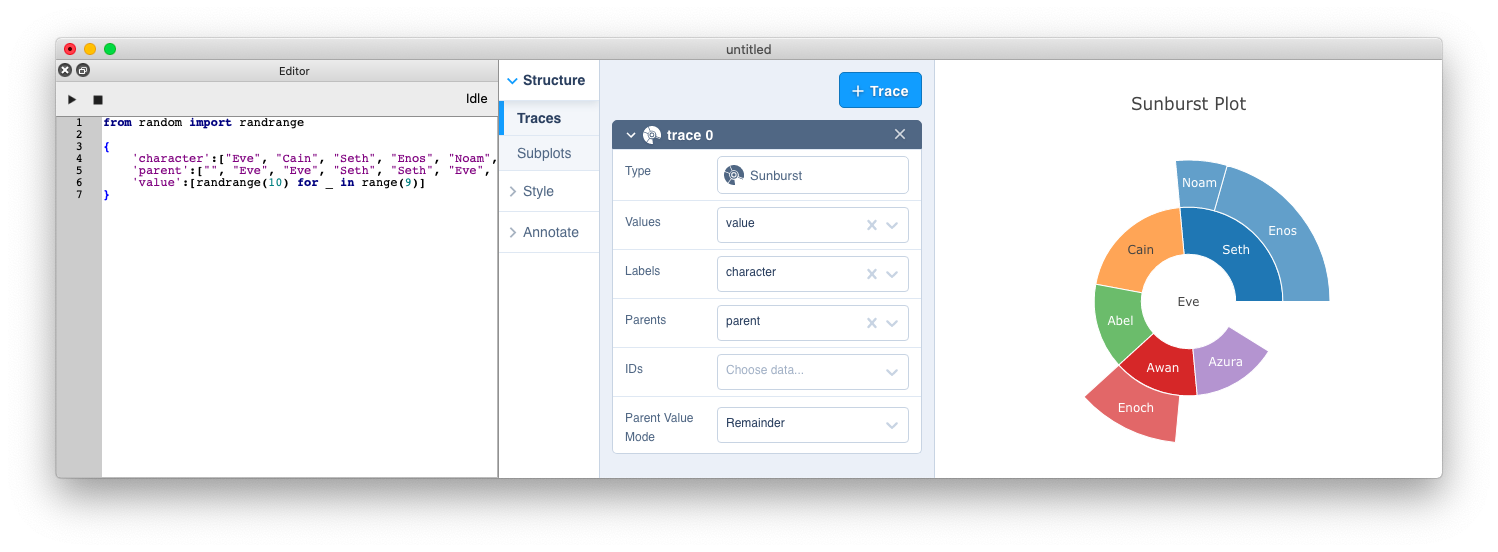
A python based chart design tool
PyChart integrates a Python scripting for data generation and the Plotly react-chart-editor for interactive chart design into a Qt based application. It strives to ease the friction between data and display by leveraging Python scripting for data creation and manipulation and a user interface for the often difficult process of chart design and layout.
Features
- Fast script execution and interruption
- Export charts as PNG files or to the clipboard
- Run chart scripts from the command-line
- Run from the command-line
Check it out on GitHub.